Tabs
As briefly discussed earlier, Panoptic offers a tab system allowing different viewpoints to be maintained in parallel on the same corpus.
Example Use Case
The objective is to create workspaces dedicated to certain objects using filters, sorts, and groups. A basic example is the use of a "trash" tab. A first exploration tab is used, in which images are annotated with a "out of corpus" checkbox property while applying a filter on this property. All checked images then instantly disappear from the first tab thanks to this filter and appear in another tab that has the inverse filter (i.e., only showing images that have the "out of corpus" box checked). This allows one to occasionally refocus on the "trash" tab to review images that have been designated as out of corpus and to verify that no errors have been made, without having to see these images in the main view.
Views
If each tab can have its own filters, sorts, and groups, it is also possible to configure the desired display at the tab level by choosing the view. 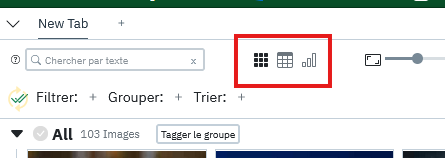
Grid View
The default view displays a simple grid of images.
Table View
A classic table view, it allows focusing more on the properties accompanying the images, especially text properties that can take up space.
Graph View
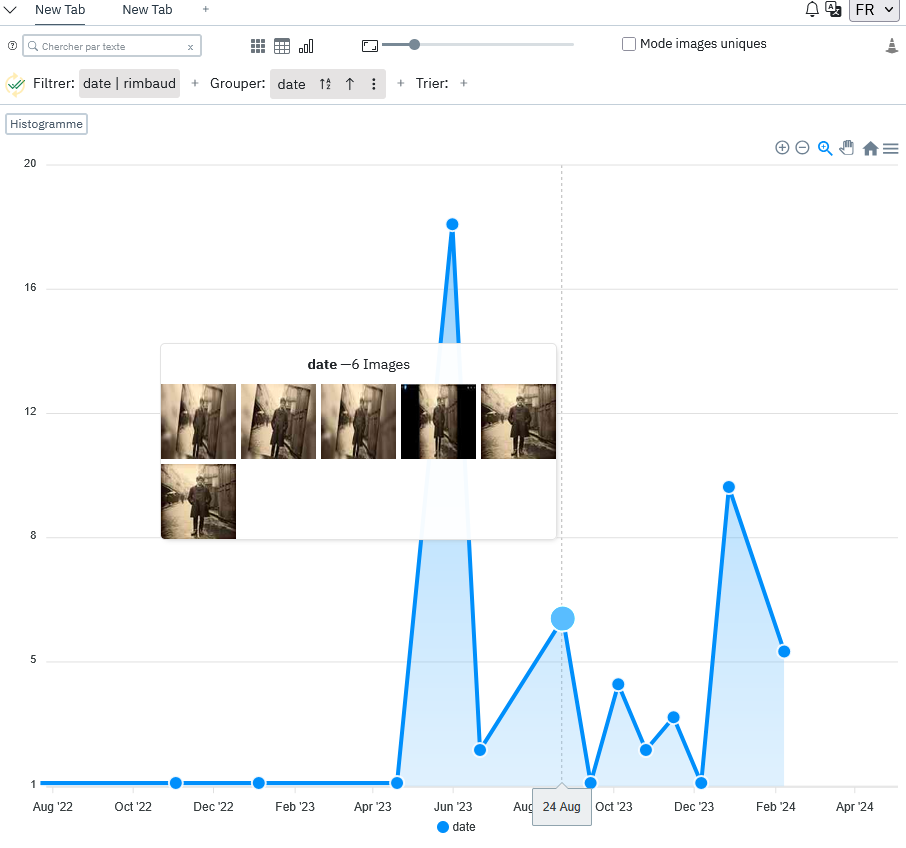
A view that is still a bit experimental but allows displaying graphs showing the number of images contained in a grouping. Example, if I group my images by date and switch to graph view, I can display the number of images at each date, as well as a preview of the images at that date by hovering over a point:
Note
It should be noted that all filters and sorts are also applied in real time in this view, which allows you to modify your graph on the fly according to other properties you might have. In the example above, only the graph between certain dates is displayed, and only images that have been tagged as "rimbaud". Similarly, grouping by date allows changing the granularity of the grouping by choosing by minute, hour, day, week, month, year. These changes are also reflected in the graph.
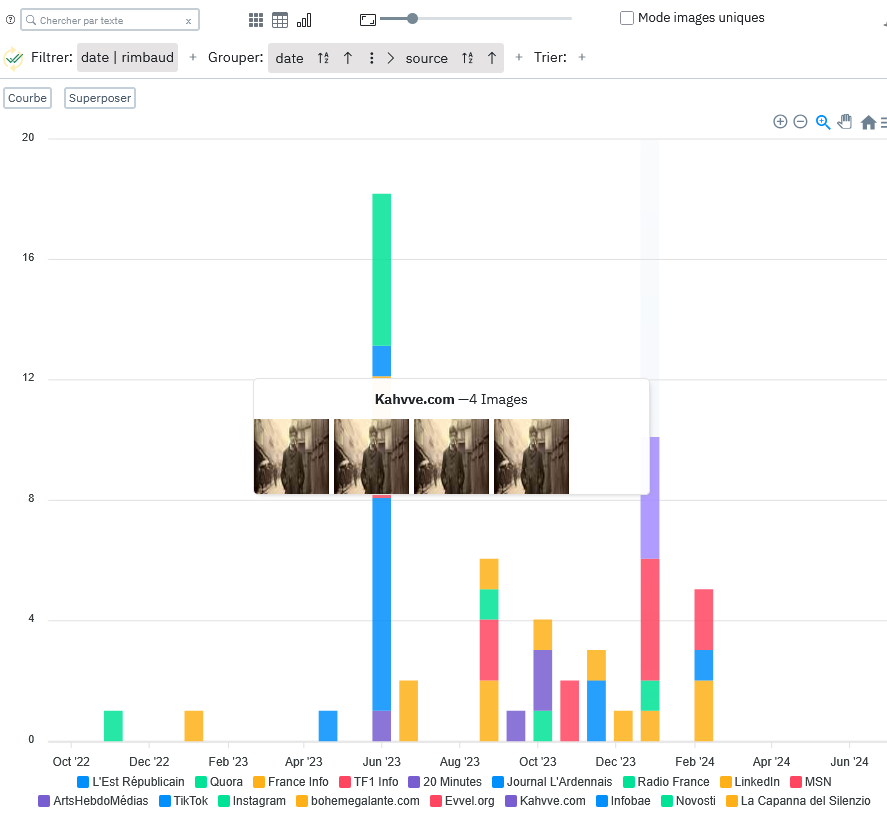
It is also possible to add a new grouping to split the graph according to another property. Here, for example, we add a grouping after the date to then group by the type of source from which the images originate at each date. (We also changed the graph type to histogram by clicking on the "Histogram" button).